

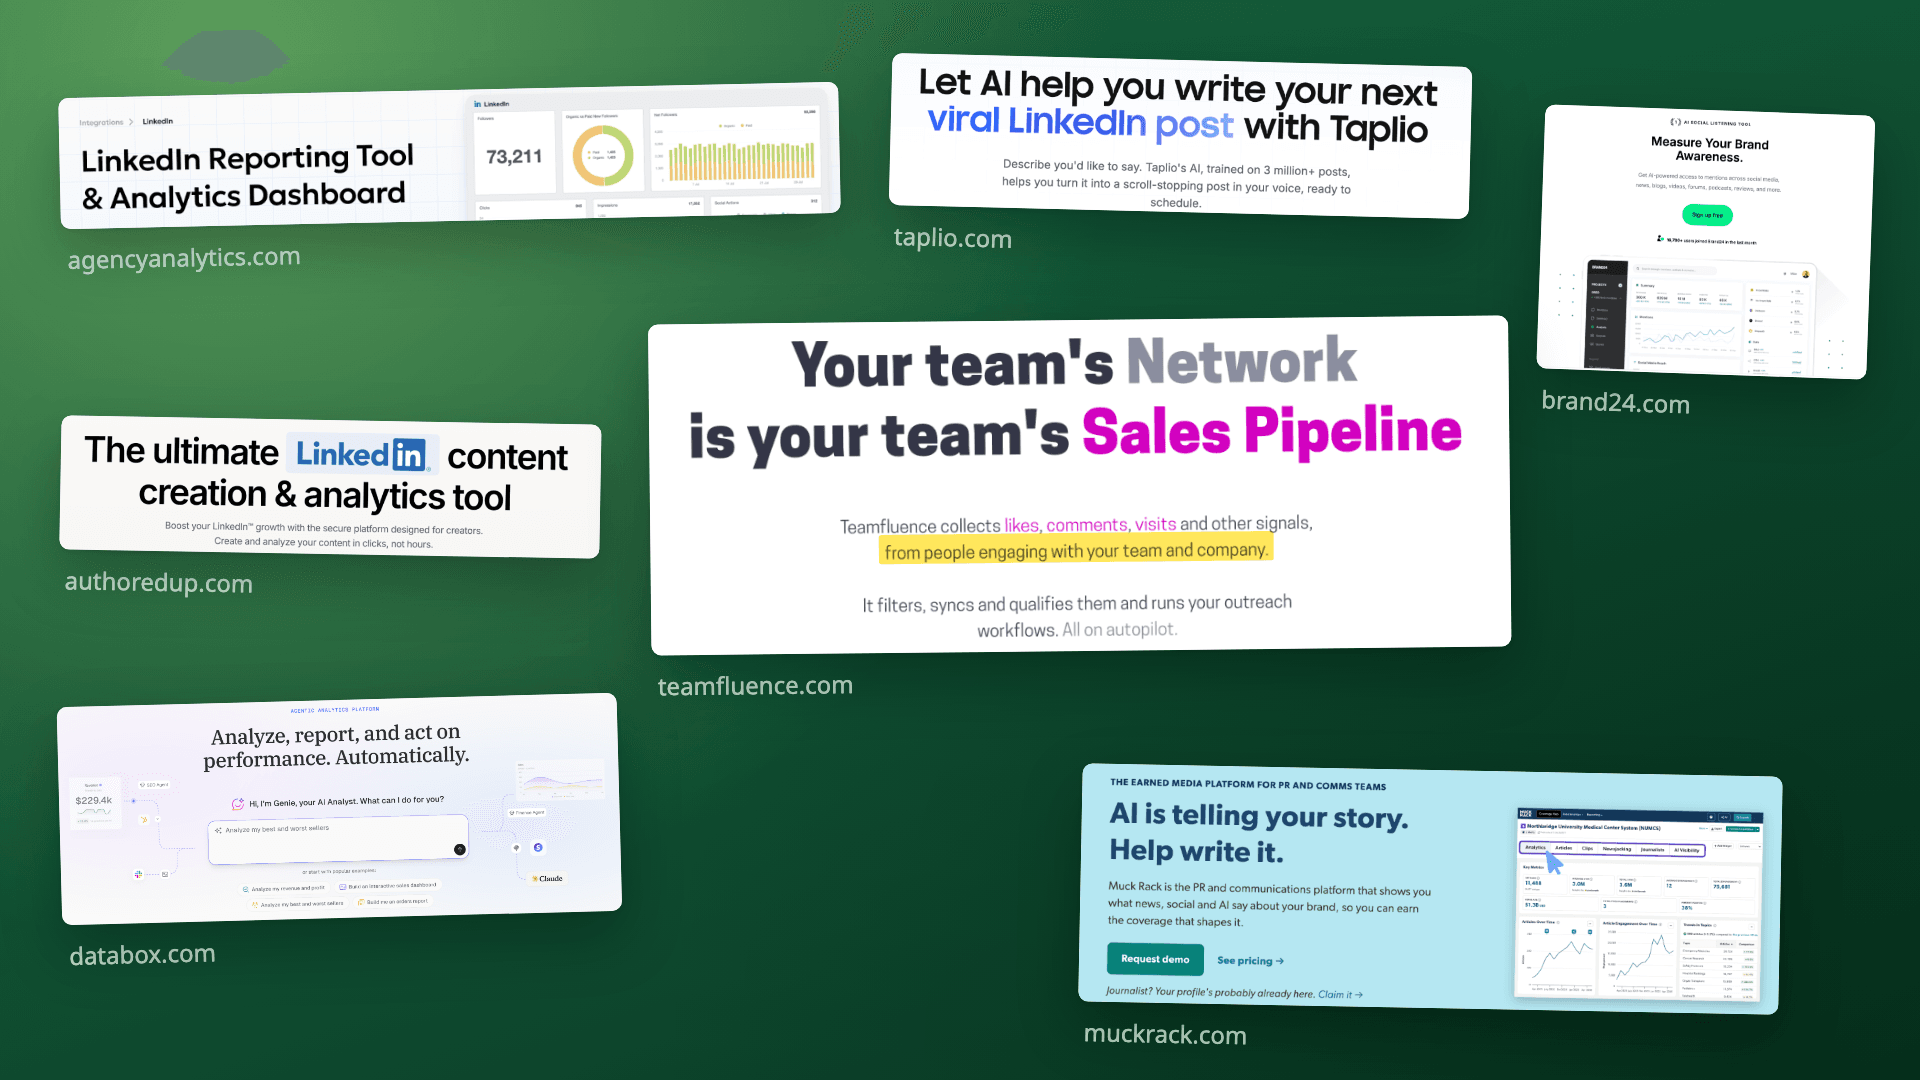
Short answer: Most executive branding reports show reach: impressions, followers, profile views. Clients also want to know who engaged and whether it led anywhere. Teamfluence gives each client a workspace that lists the people who engage with their executives' posts and profiles, scores them against the client's ICP or target accounts, and sends the qualified ones to the client's CRM. For the rest of the report, agencies add Taplio or AuthoredUp for content and post analytics, AgencyAnalytics or Databox for a branded dashboard, and Brand24 or Muck Rack for mentions and press coverage. Most agencies need two or three of these, not all of them.
Last updated: 10 November 2026
The co-founder of an executive branding agency put his business in one line on a call with us: "We sell a service and outcomes."
The monthly report usually shows the service. The posts that went out, impressions, new followers. The outcome is the part the client's CEO asks about in the renewal meeting: did the right people notice, and did any of it turn into business?
This post compares the tools agencies use to answer both. Every competitor and LinkedIn fact links to their own pages, checked on 2 November 2026.
What should an executive branding agency show clients?
Four layers. Most reports stop after the second.
| Layer | The client's question | Where the data comes from |
|---|---|---|
| 1. Output | Did you do the work? | Your content calendar, Taplio, AuthoredUp |
| 2. Reach | Did people see it? | LinkedIn analytics, Taplio, AuthoredUp, AgencyAnalytics |
| 3. Who engaged | Were they the right people? Which accounts? | Teamfluence (names, ICP score, target accounts) |
| 4. What it led to | Did it start conversations or deals? | The client's CRM, fed by Teamfluence |
If the engagement includes press and podcasts, add a fifth: mentions and coverage (Brand24, Muck Rack).
Layers 1 and 2 are easy to collect and easy to dismiss. Layer 3 is where a report changes the conversation: "Lena B., VP Sales at Northwind Freight, one of your target accounts, liked two posts and visited your CEO's profile this month." Layer 4 is what keeps the retainer. Our content-to-pipeline report walks through how to structure all four in one client report.
Why can't LinkedIn's own analytics show this?
They show part of it, to one person. LinkedIn's post analytics include impressions, members reached, reactions, comments, reposts, profile viewers and followers gained from a post, and viewer demographics such as "job title, location, company, company size, industry" (LinkedIn Help). Demographics only appear when there are enough unique viewers to protect privacy, so they describe the audience as a group.
Three things make it hard to use for a client report:
- It's private to the person who posted. LinkedIn says post analytics are visible only to the member who published the post (LinkedIn Help). So the executive, or someone with their permission, has to pull it every month.
- Names are limited. You can click through reactions and comments on each post. Profile viewers are a different story: a free account shows the three most recent viewers from the last 90 days, and Premium shows the full list for up to 365 days (LinkedIn Help).
- Nothing adds up. Each executive's posts, profile and the company page are separate. There's no filter for the client's ideal customer and no list to send to their CRM.
That's fine for a quick check. It doesn't make a monthly report on its own.
Which tools do executive branding agencies use to show clients results?
| Main job | Shows who engaged, by name | Many clients | Client-facing output | Starts at | |
|---|---|---|---|---|---|
| Teamfluence | Engagement into qualified leads | Yes, scored against ICP or target accounts | One workspace per client, one login | CSV, the client's CRM, Slack | $299/month |
| Taplio | Write, schedule, analyze posts | Lists likers and commenters (per-post limits) | Multiple accounts, client roles | Shared analytics, monthly stats email | $39/month |
| AuthoredUp | Write posts, post analytics | Not listed (totals and averages) | Multiple profiles on Business | CSV export, Analytics API | $14.95 per profile/month (3+) |
| AgencyAnalytics | White-label client reporting | Not listed (company page metrics) | Priced per client | White-labeled client portal | $20 per client/month, billed annually |
| Databox | KPI dashboards | No | Agency plan with account packs | Dashboards; white label as an add-on | Free plan; Agency from $79/month, billed annually |
| Brand24 | Mentions across the web | Mentions, not post engagers | Unlimited users from the Team plan | PDF, Excel and white-labelled reports | $199/month, billed annually |
| Muck Rack | PR and media coverage | No | Priced by number of users | Coverage reports | Pricing on request |
"Not listed" means the company's own site doesn't say, as of 2 November 2026. Ask them if it matters to you.
Teamfluence: to show clients who engaged and what it led to
Teamfluence collects the people who engage with a team: likes, comments, profile visitors, new connections, followers of personal profiles and the company page, and people who engage with thought leader ads. For an agency, that team is the client's executives.
Then it keeps the ones that matter, three ways: someone reviews by hand, an AI agent scores each person 1 to 5 against the client's ideal customer with a one-line reason, or you upload the client's target accounts. Qualified people go to the client's HubSpot or Salesforce, Slack, a webhook, a CSV export, or an AI agent (API and MCP). Each one carries what they did and when.
That covers layers 3 and 4: a named list for the report, and a record in the client's CRM their sales team can act on and log outcomes against.
For agencies, the partner program adds a workspace for each client, switched from one login, co-branding so clients see your agency next to ours, central billing, and admin seats for your team "that don't collect engagement data."
- Best for: executive branding and content agencies whose clients sell B2B and ask what the content brought in.
- Less suited if: your reports are mainly about reach, mentions and press coverage, or the client's buyers aren't active on LinkedIn.
- Price: public plans from $299/month for 500 qualified leads, or $499/month for 1,000, with unlimited seats (pricing). You pay for leads, not seats. The agency pack is set up on a call.
Taplio: to run the content and show what performed
Taplio is a LinkedIn content tool: scheduling, AI post writing, analytics on "your posts, audience and engagements", and a monthly stats email. Its pricing page also lists auto-adding likers and commenters to a list (20 per post or unlimited, depending on plan), importing likers from a post, and a lead database. For agencies it offers managing multiple accounts, shared analytics across accounts, and admin, writer and client roles, with a multi-seat discount of up to 30%.
- Best for: agencies that write and schedule for several executives and want output, reach and post performance in one place.
- Less suited if: you need engagers scored against each client's ICP or target accounts and sent to their CRM: the pricing page doesn't list a CRM.
- Price: Starter $39/month, Growth $69, Pro $199, billed monthly; 7-day free trial (taplio.com/pricing).
AuthoredUp: for post analytics across every executive
AuthoredUp is a LinkedIn editor with content analytics. The Business plan connects multiple profiles "for agencies", keeps each profile's drafts and analytics separate, and adds one team dashboard across all member profiles and company pages. Analytics export to CSV, and there's an Analytics API. Read-only links let a client review a draft without an account.
- Best for: agencies that want clean post analytics per executive and a draft approval step with the client.
- Less suited if: the client wants names: the pricing page describes reactions, comments and impressions as totals and averages.
- Price: $19.95/month for one profile; Business $14.95 per profile/month (3+ profiles); custom plans from 10 profiles (authoredup.com/pricing).
AgencyAnalytics: for one branded portal across channels
AgencyAnalytics is built for agencies reporting to clients: a white-labeled client portal with your logo, colors and custom domain, priced per client. Its LinkedIn integration "reports LinkedIn company analytics": clicks, comments, followers, impressions, likes, shares, and follower demographics by location, seniority, company size, job function and industry. It needs a company page and a Super Admin role, and the page doesn't mention personal profiles.
- Best for: agencies whose executive branding retainers also cover the company page, SEO or ads, and want one portal for all of it.
- Less suited if: most of the work happens on executives' personal profiles.
- Price: $20 per client/month, billed annually; volume pricing from 25 clients; 14-day free trial (agencyanalytics.com/pricing).
Databox: for KPI dashboards and goals
Databox turns numbers from many sources into dashboards and goal tracking. The Agency plan includes unlimited users, custom templates and cross-account reporting, and grows with account packs. White label is an add-on that replaces Databox branding with your logo, colors and domain.
- Best for: agencies that want each client to open one dashboard with three or four agreed KPIs and progress against goals.
- Less suited if: you need the data itself: Databox shows numbers you connect from other tools, so the "who engaged" layer has to come from somewhere else.
- Price: free plan; Agency from $79/month billed annually, plus account packs; white label $80/month as an add-on (databox.com/pricing).
Brand24: for mentions beyond the client's own posts
Brand24 monitors mentions of keywords, like an executive's name or their company, across the web and social media. Its pricing page lists PDF, Excel and white-labelled reports.
- Best for: showing that an executive is being talked about more, and where.
- Less suited if: you want to know who engaged with the executive's own posts: it tracks mentions, not engagers.
- Price: Individual $199/month billed annually ($249 monthly, 3 keywords); Team $299/month billed annually (7 keywords, unlimited users); 14-day free trial (brand24.com/prices).
Muck Rack: for press and podcast coverage
Muck Rack is a PR platform with media monitoring, alerts, coverage reports and dashboards. Podcast monitoring is on its Standard and Premier plans.
- Best for: agencies that place executives in articles, podcasts and panels and need to report that coverage.
- Less suited if: the work is mostly LinkedIn content.
- Price: not public; "Pricing depends on a few factors specific to your team including the number of users" (muckrack.com/pricing).
Which combination fits your agency?
- You ghostwrite LinkedIn posts for a handful of executives: Taplio or AuthoredUp for output and reach, plus Teamfluence for who engaged.
- You run many clients across channels and want one portal: AgencyAnalytics or Databox for the dashboard, plus a "who engaged" page from Teamfluence next to it.
- Your clients sell to a target account list: Teamfluence with the account list uploaded, so the report starts with the accounts that showed up. More in how to track LinkedIn engagement from your target accounts.
- You do PR as much as content: Brand24 or Muck Rack for coverage, plus one of the above for LinkedIn.
What does a "who engaged" page look like?
One table per month, sorted by score. Here's an example for a CEO and a head of sales at a logistics software company (fictional people):
| Person | Company | Fit | What they did | Next step |
|---|---|---|---|---|
| Lena B., VP Sales | Northwind Freight (target account) | 5: VP at a 200-person freight company, the buyer role | Liked 2 CEO posts, visited the head of sales' profile | In HubSpot, account owner messaged on 6 Nov |
| Tom R., Head of Operations | Harbor Logistics | 4: right industry, ops leader | Commented on the CEO's post about dispatch | Watch: one more signal, then reach out |
| Priya S., COO | Lakeside Haulage (target account) | 5: decision maker at a target account | Followed the company page, visited the CEO's profile | Meeting booked 9 Nov |
| 41 others | 1 to 3: peers, recruiters, students | Liked or commented | Not sent to the CRM |
Three rows the client cares about beat a chart of impressions. The last row matters too: it shows you filtered, so the names at the top mean something. How the 1 to 5 scoring works: how to qualify people who like your LinkedIn posts.
Put this page first in the report, then output and reach. For the full monthly structure, see the content-to-pipeline report. For which numbers to track over a quarter, see how to measure the ROI of founder-led content on LinkedIn.
FAQ
Can I show a client who liked their executive's posts without a tool? Partly. Reactions and comments on each post are visible to anyone who can see the post, so you can copy names by hand. Profile viewers are visible only to the profile's owner, and viewer demographics come as a group, not names. It works for one executive for a week. It doesn't scale to ten executives every month.
What's the difference between reporting reach and reporting who engaged? Reach says how many people saw the content: impressions, followers, profile views. Who engaged says which people, at which companies, and whether they fit the client's buyer. Taplio, AuthoredUp and AgencyAnalytics cover reach. Teamfluence covers who engaged.
Do I need a white-label reporting tool? Only if clients expect to log into a portal with your brand. AgencyAnalytics includes a white-labeled portal; Databox sells white label as an add-on. Teamfluence offers co-branding, which puts your agency next to ours so clients see the service they hired you for.
How many clients can I run in Teamfluence? As many as you need. Each client gets its own workspace, and you switch between them from one login (partners).
How do I show pipeline if the client owns the CRM? Send qualified people straight into the client's HubSpot or Salesforce, so their sales team sees them and logs what happens. Then report from their CRM: conversations started, meetings booked, deals that include someone who engaged. Setup: HubSpot, Salesforce.
Which signals should go in the client report? Repeats from the right people. One like from a peer is noise. A like, a profile visit and a company page follow from someone at a target account in the same month is worth a line in the report. For a team view of the same question, see the best tools to see who engages with your team's LinkedIn posts.
Show your clients who engaged
If you run executive branding for B2B clients and want each monthly report to start with names, accounts and meetings: talk to sales and we'll show it on one of your clients' data.
Related: The content-to-pipeline report for agencies · Best tools to see who engages with your team's LinkedIn posts · How to measure the ROI of founder-led content on LinkedIn